Performance
The performance profiler measures how long the app takes to start and why: requests, bundles, preload, asynchronous loading, OData calls and a blocked main thread. Every check gets a traffic light and a concrete recommendation. The profiler is part of the Pro edition.
- Edition
- from Pro
- Tab
- “Performance”
- Sharing budgets
- via team sync with Team
- Surfaces
- DevTools panel and side panel
- On PROD
- measuring allowed, deep profile locked
The tab at a glance
Open the FrontTailor panel in DevTools (F12) or the side panel and choose the Performance tab. The measurement options are at the top; after the first measurement the report follows below. Nothing runs in the page until you click Start measurement.
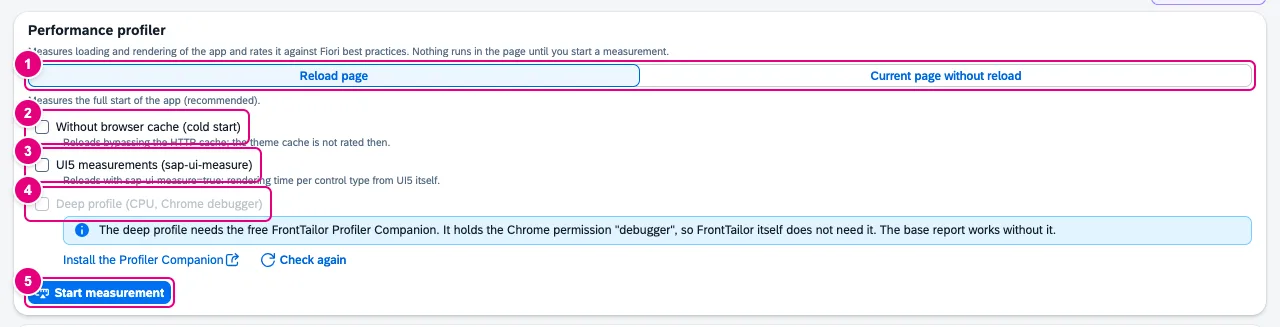
- Reload page measures the full start of the app (recommended). Current page without reload evaluates what happened since the last load.
- Without browser cache (cold start) reloads bypassing the HTTP cache; the theme cache is not rated then.
- UI5 measurements (sap-ui-measure) reloads with
sap-ui-measure=trueand gives the rendering time per control type from UI5 itself. - Deep profile (CPU, Chrome debugger): CPU time per UI5 library and app function, see below.
- Start measurement.
Start a measurement
- Open the app in the browser and choose the Performance tab in the panel.
- Keep Reload page selected. For a cold start also tick Without browser cache (cold start).
- Click Start measurement. The profiler reloads the page and waits until it is quiet: 1.5 seconds without new requests, at most 18 seconds.
- The report appears and is saved as a measurement. Give it a name in the Name of the measurement field, for example “before preload fix”.
If the page does not become quiet in time, the report says “The page did not become quiet within the wait limit; late requests may be missing.” The address is stored without its query string.
The report
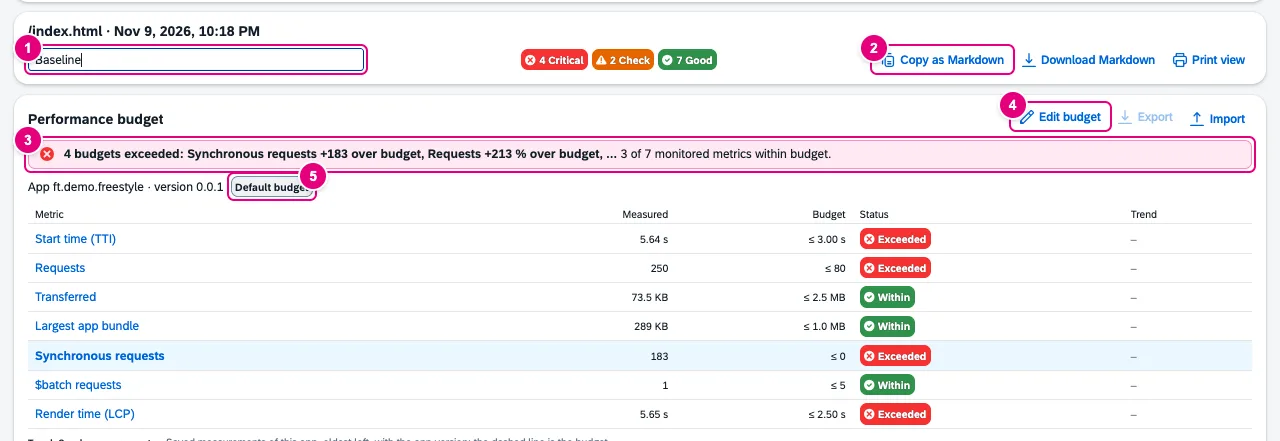
- Name of the measurement – shown in the list of saved measurements and in the export. Next to it the summary of the ratings: critical, check, good.
- Copy as Markdown, Download Markdown and Print view (see export).
- The budget verdict: “Budget kept.” or which budgets are exceeded.
- Edit budget opens the limits of this app (see budgets).
- Where the budget comes from: Default budget, Own budget or Team budget.
The report sections follow below:
| Section | Content |
|---|---|
| Key figures | Time to interactive, First contentful paint, Largest contentful paint, UI5 core loaded, Requests, Transferred, Uncompressed, Single UI5 modules, OData requests, Slowest OData call, Total blocking time |
| Timeline | First byte, UI5 core, Component preload, First OData, FCP, LCP, Interactive and Load event on one axis, long tasks as red bars |
| Best-practice check | every rule with rating, measured value and recommendation (see below) |
| Requests and sizes | count, transferred and uncompressed size per group: UI5, App, OData, Theme and fonts, FrontTailor, Other |
| Largest resources | the largest files with size and duration |
| Slowest OData calls | request, start, duration and status; the source is the OData console, otherwise Resource Timing |
| Rendering hotspots | script time in long animation frames per function – with UI5 measurements the rendering time per control type |
| CPU (deep profile) | self time per group and library, only with the deep profile |

- Time to interactive is an approximation: the moment from which the page was quiet.
- The timeline shows the order in which the app loads and where long tasks block the main thread.
Below the key figures sits the Performance tips card: local checks over the measurement, the OData log and load findings – without AI. With your own key the AI can also explain the measurement, see AI assistant.
Best-practice check
Every rule gets a rating: Good, Check, Critical or Info. For Check and Critical the line next to the light bulb says what to change. Critical findings come first.
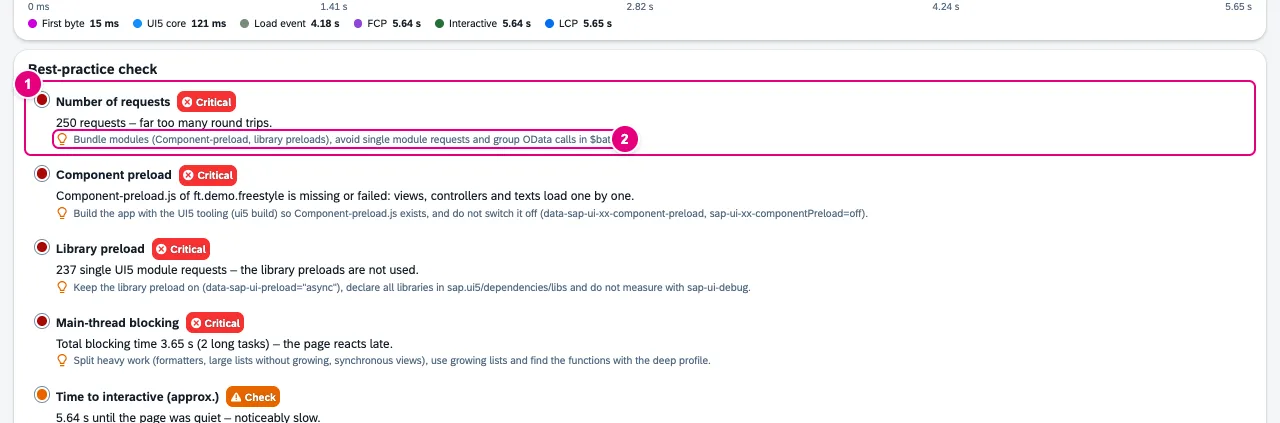
- Rule, rating and measured value.
- The recommendation, here: work through the other findings, because preload bundles, asynchronous loading, fewer requests and
$batchshorten the start most.
The limits are FrontTailor rules of thumb, not SAP limits:
| Check | Good up to | Check up to | Critical above |
|---|---|---|---|
| Time to interactive (approx.) | 3 s | 6 s | 6 s |
| Number of requests | 80 | 150 | 150 |
| Download size (transferred) | 2.5 MB | 5 MB | 5 MB |
| Single UI5 modules (library preload) | 15 | 60 | 60 |
OData requests without $batch | 3 | 10 | 10 |
| Slowest OData call | 1 s | 3 s | 3 s |
| Blocking time (main-thread blocking) | 300 ms | 1 s | 1 s |
Rules without a threshold come on top: a missing Component preload is critical, and so is a synchronous loader (Asynchronous loading) or synchronous routing (Asynchronous routing). You get a warning when the manifest arrives only after the component code (Manifest first), when more than twelve libraries are declared without lazy (Lazy loading), when the theme CSS does not come from the cache (Theme cache) and when Debug mode is on.
Performance budgets per app
A budget sets limits for one app. Every measurement of that app is checked against them, and the verdict sits at the top of the report. FrontTailor recognises the app by sap.app.id and the version by applicationVersion in the manifest.
| Metric | Default |
|---|---|
| Start time (TTI) | 3.0 s |
| Requests | 80 |
| Transferred | 2.5 MB |
| Largest app bundle | 1.0 MB |
| Synchronous requests | 0 |
| $batch requests | 5 |
| Render time (LCP) | 2.5 s |
- Measure the app once so FrontTailor knows the app ID and version.
- In the Performance budget card, click Edit budget.
- Adjust the limits or switch metrics off; switched-off metrics are not monitored. Use Note to record where a value comes from, for example the release review.
- Click Save. The card now shows Own budget; Reset to defaults brings back the default values.
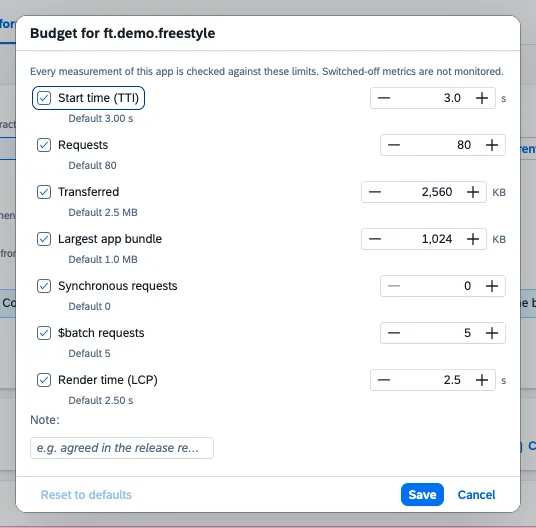
The card’s table shows Measured, Budget and Status for each metric (Within, Exceeded, Not monitored, Not measured). Clicking a metric shows its Trend across the saved measurements with the app version; the dashed line is the budget. The trend appears from two saved measurements of the app. That is how the verdict can say, for example, “Start time (TTI) +38 % since version 1.4.0”.
Export writes the budgets of all apps as JSON, also for CI scripts; Import reads them back. With from Team, team sync hands the budgets to everyone in the team (Team sync). If an administrator sets a budget, it cannot be changed in the panel.
Save and compare measurements
Every measurement goes to the Saved measurements card: per app the latest ten plus one from each older app version. They are stored locally in the browser, without query strings. Show brings back an old report, Delete measurement removes it.
- Measure before the change and give the measurement a name.
- Change the app – for example build preload bundles – and measure again.
- In Saved measurements, pick the measurements for Before and After and click Compare.
- The Comparison card shows every key figure with before, after and Change (better, worse, unchanged), and below it every check with both ratings. Close comparison returns to the report.
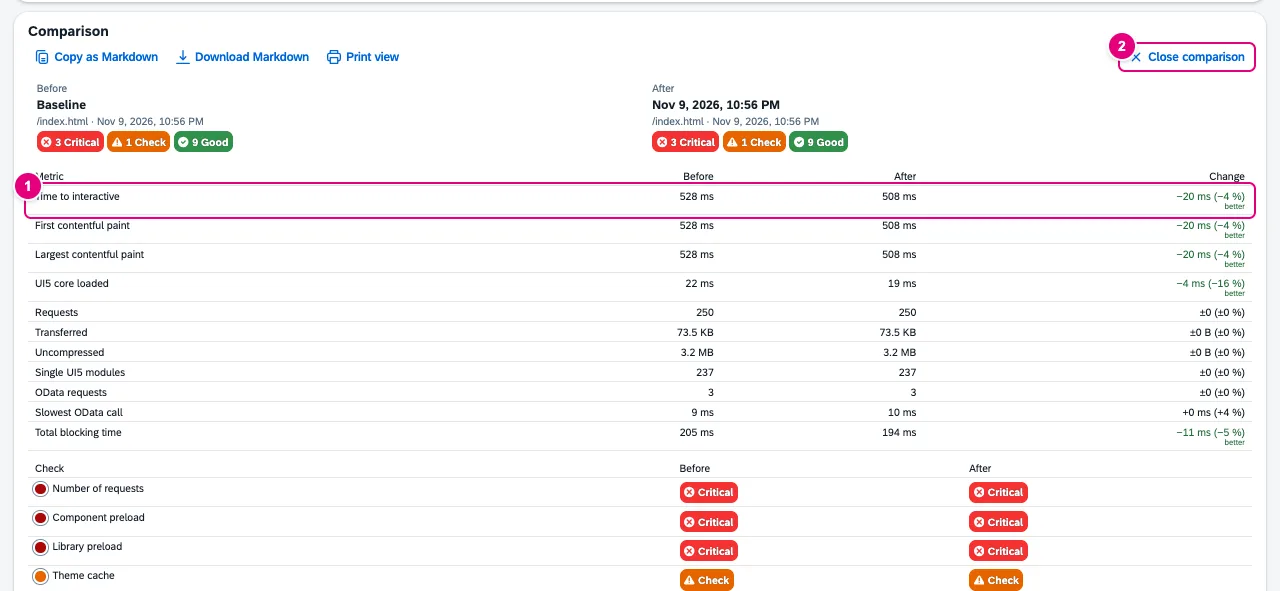
- Key figure with before, after and the change in time and percent.
- Close comparison.
Export and print view
| Button | Result |
|---|---|
| Copy as Markdown | report or comparison as Markdown with tables on the clipboard, for example for a ticket or a pull request |
| Download Markdown | the same content as an .md file |
| Print view | a static HTML page in a new tab, to print or save as PDF from the browser |
FrontTailor sends no report anywhere: all three stay in your browser.
Deep profile with the Profiler Companion
The deep profile records CPU time per UI5 library and app function plus all network requests over the Chrome debugger. It needs the free add-on extension FrontTailor Profiler Companion: it holds the Chrome permission debugger, so FrontTailor itself does not need it.
- If the companion is not installed, a note below the option offers Install the Profiler Companion. After installing it, click Check again.
- Tick Deep profile (CPU, Chrome debugger) and click Start measurement.
- While measuring, Chrome shows the bar “FrontTailor Profiler Companion started debugging this browser”. It disappears when the measurement ends; closing it cancels the deep profile – the base report stays complete.
- The report then contains the CPU (deep profile) section with self time per group, library and function.
The deep profile ends after 90 seconds at the latest. It is not available in Firefox, because it needs the Chrome debugger.
Typical problems
| What you see | Cause and fix |
|---|---|
| “No measurement yet. Start one to see the report.” | The profiler only measures on a click. Click Start measurement. |
| “… did not become quiet …; late requests may be missing.” | The app is still loading after 18 seconds, for example because of polling. The report is still useful; late requests are missing. |
| Theme cache shows Info instead of a rating | With Without browser cache (cold start) the theme cache is not rated. |
| Rendering hotspots name no control types | Switch on UI5 measurements (sap-ui-measure) for rendering time per control type. |
| Deep profile is greyed out | The Profiler Companion is missing or too old, the browser has no Chrome debugger, or the host is marked as PROD. The note below the option names the reason. |
| No budget verdict | The page has no app component (no sap.app.id) or every metric is switched off: “No budget is monitored for this app.” |
See also
- Features at a glance Features · Performance
- Further reading SAPUI5 – The Comprehensive Guide (SAP PRESS)
- Help from people Fiori performance review
- Docs OData console
- Docs Host profiles and PROD
- Docs AI assistant
- Sources ADR-0161 · ADR-0442