OData console
The OData console records every OData request of the app, splits $batch into its parts and shows the backend’s error text the way Gateway, RAP or CAP mean it. On top come replay with preview, export without tokens, saved filters and the service as a diagram. Everything stays in the browser.
- Edition
- Community
- Tab
- “OData”
- Surfaces
- DevTools panel and side panel
- Protocol
- OData V2 and V4,
$batchmultipart and JSON - Storage
- per tab up to 2,000 requests or 50 MB
- On PROD
- display and export, replay locked
The tab at a glance
Open the OData tab in the DevTools panel or the side panel and use the app. Every OData request appears as a row; a $batch expands into its parts. The narrow side panel only hides the time and size columns.
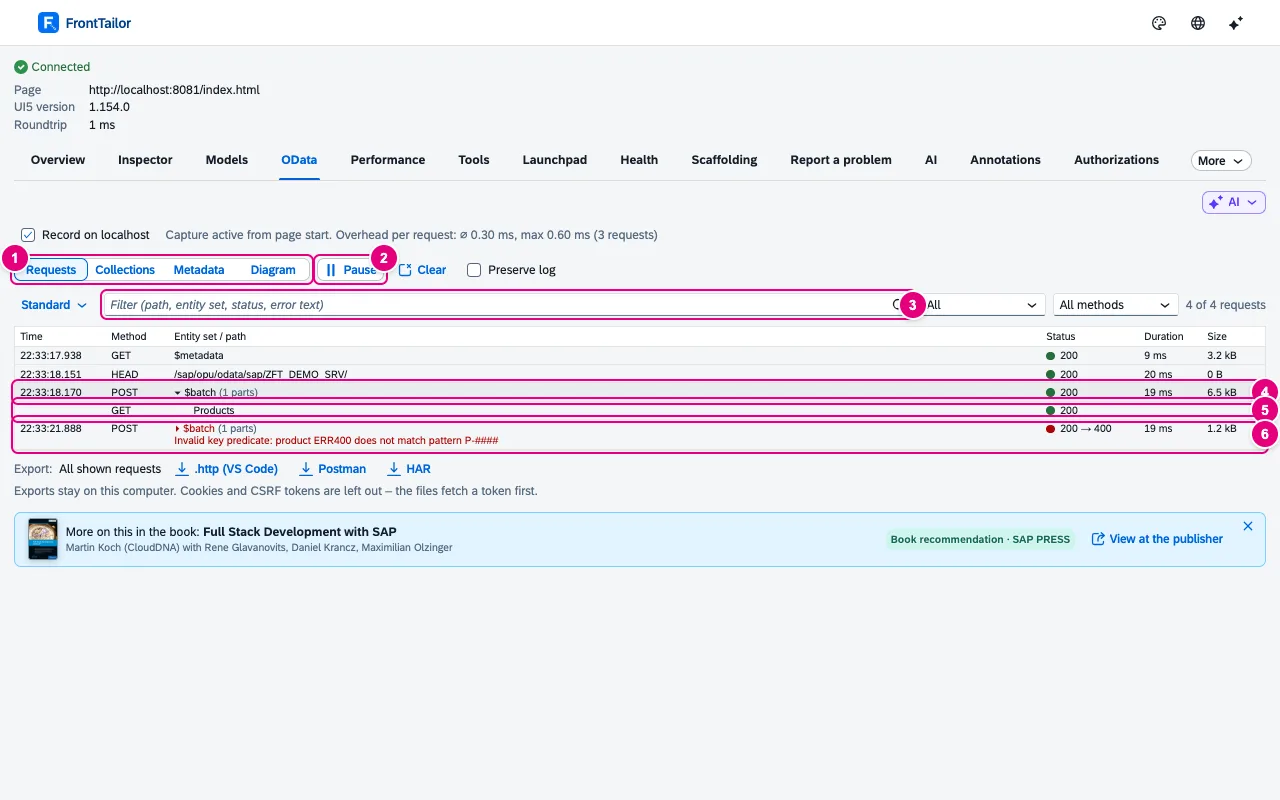
$batch answers 200, its part 400.- Four views of the same log: Requests, Collections, Metadata and Diagram.
- Pause stops recording, Clear empties the log, Preserve log keeps it across reloads.
- Filter by path, entity set, status and error text – inside batch parts, too. To the right: status (All, Errors, successful), method and service.
- A $batch with its number of parts. A click expands it.
- A batch part: clickable like a request of its own.
- A failed request: red light,
200 → 400means “envelope 200, part 400”, the error text below.
Above the table you see whether capture runs from page start, and the measured overhead per request. The Record on … checkbox switches recording off or on for this host; it takes effect from the next page load. The exports are below the table.
| Column | Content |
|---|---|
| Time · Method | Start of the request and HTTP method. |
| Entity set / path | Path relative to the service; for $batch the number of parts and change sets, for errors the error text. |
| Status | Light and HTTP status. For a $batch the worst part counts. from cache when the browser answered. |
| Duration · Size | Run time and size of the response. |
Read errors: message, transaction ID, error log
- Click the red row in the table. For a
$batch, the failed part opens. - In the details, choose the Error tab.
- Read message, code, transaction ID and resolution hints. For Gateway errors, Open in Gateway error log leads to
/IWFND/ERROR_LOG.
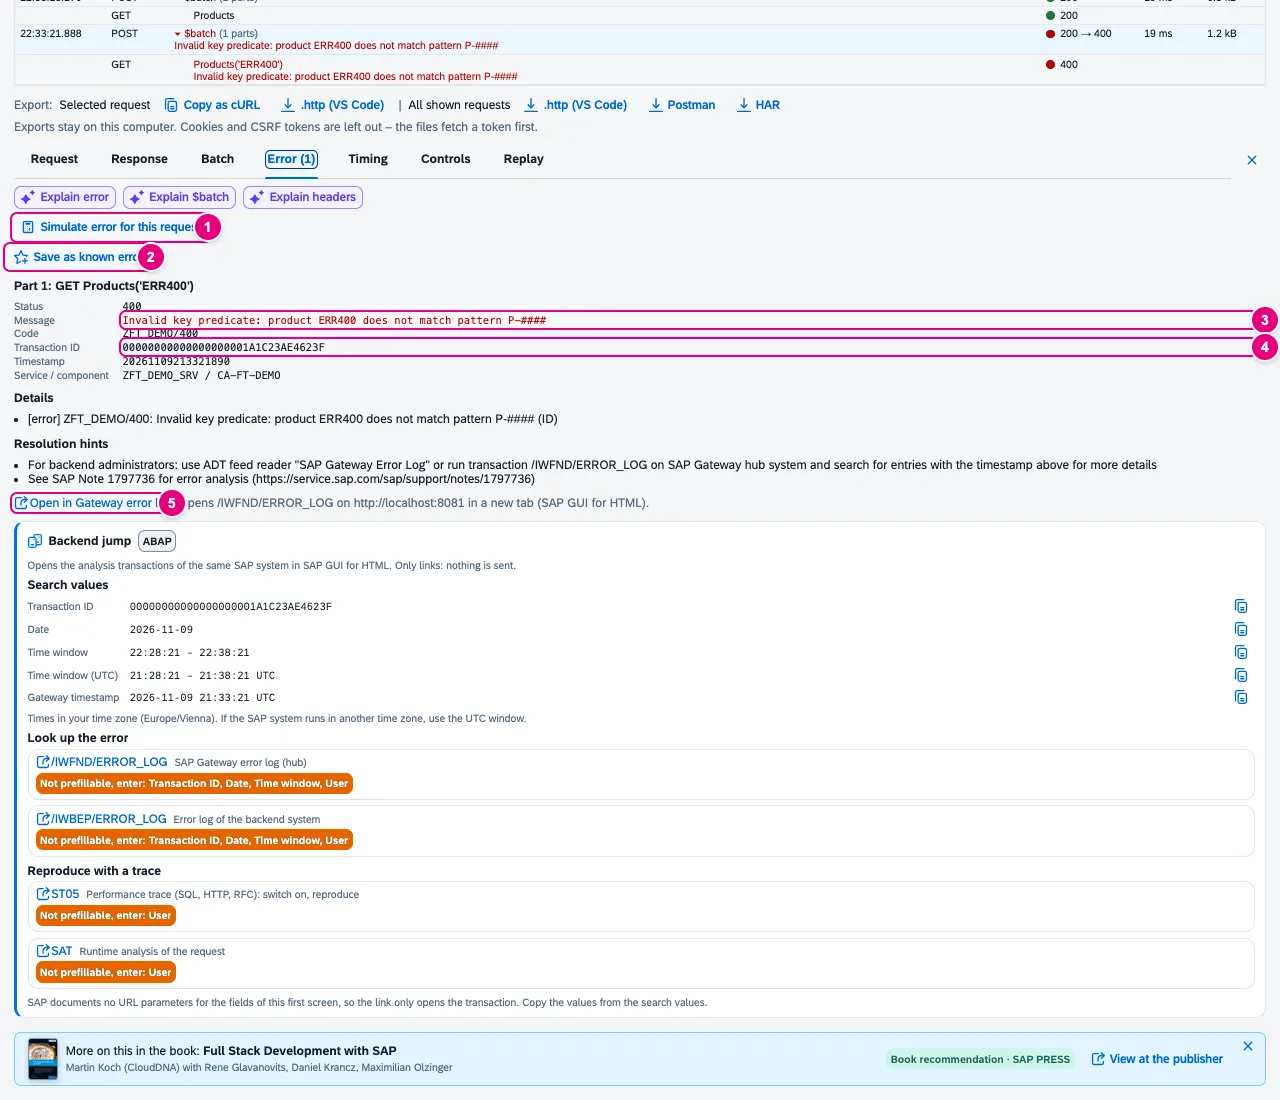
GET Products('ERR400'): the Gateway’s error text with transaction ID.- Simulate error for this request turns the request into a Fault simulation rule from Pro.
- Save as known error stores the solution for next time, see Known errors.
- Message from the error body, with code, target and details below.
- Transaction ID and timestamp for the search in the backend.
- Open in Gateway error log: a plain link to
/IWFND/ERROR_LOGon the same system, in a new tab (SAP GUI for HTML).
The console understands Gateway V2 as JSON and XML, V4 from RAP and CAP, ICF error pages as HTML and the sap-message and sap-messages headers. A change set that fails as a whole marks all its parts as change set failed; missing answers are marked as no answer.
| Detail tab | Content |
|---|---|
| Request | URL, query options, headers and body (formatted or raw), sap-contextid. |
| Response | Status, headers and body of the response. |
| Batch | All parts of the $batch with change set and status. Open as single request opens a part, Show whole $batch goes back. |
| Error | Message, code, target, details, transaction ID, timestamp, resolution hints. |
| Timing | Source (page hook, network or both), duration, server IP, Server-Timing, Cache-Control, network errors. |
| Controls | The page’s controls that bind the entity set. A click selects the control in the Inspector. |
| Replay | Edit the request and send it again, see replay. |
With from Pro the AI entries sit above the error, such as explaining the error – with your own key, see AI assistant. With from Enterprise the Backend jump card leads to the analysis transactions of the same SAP system, see Backend jump.
Replay: edit, preview, send
- Select the request in the table and open the Replay tab in the details.
- Adjust method, URL, headers (one per line,
Name: value) and body. Explain headers describes every header. - For changing requests, tick Fetch CSRF token first.
- Click Preview. It shows the exact request including the token fetch: “This request is sent from the page, with the session of the page”.
- Click Send request. The response appears below, and the request shows in the log marked Replay.
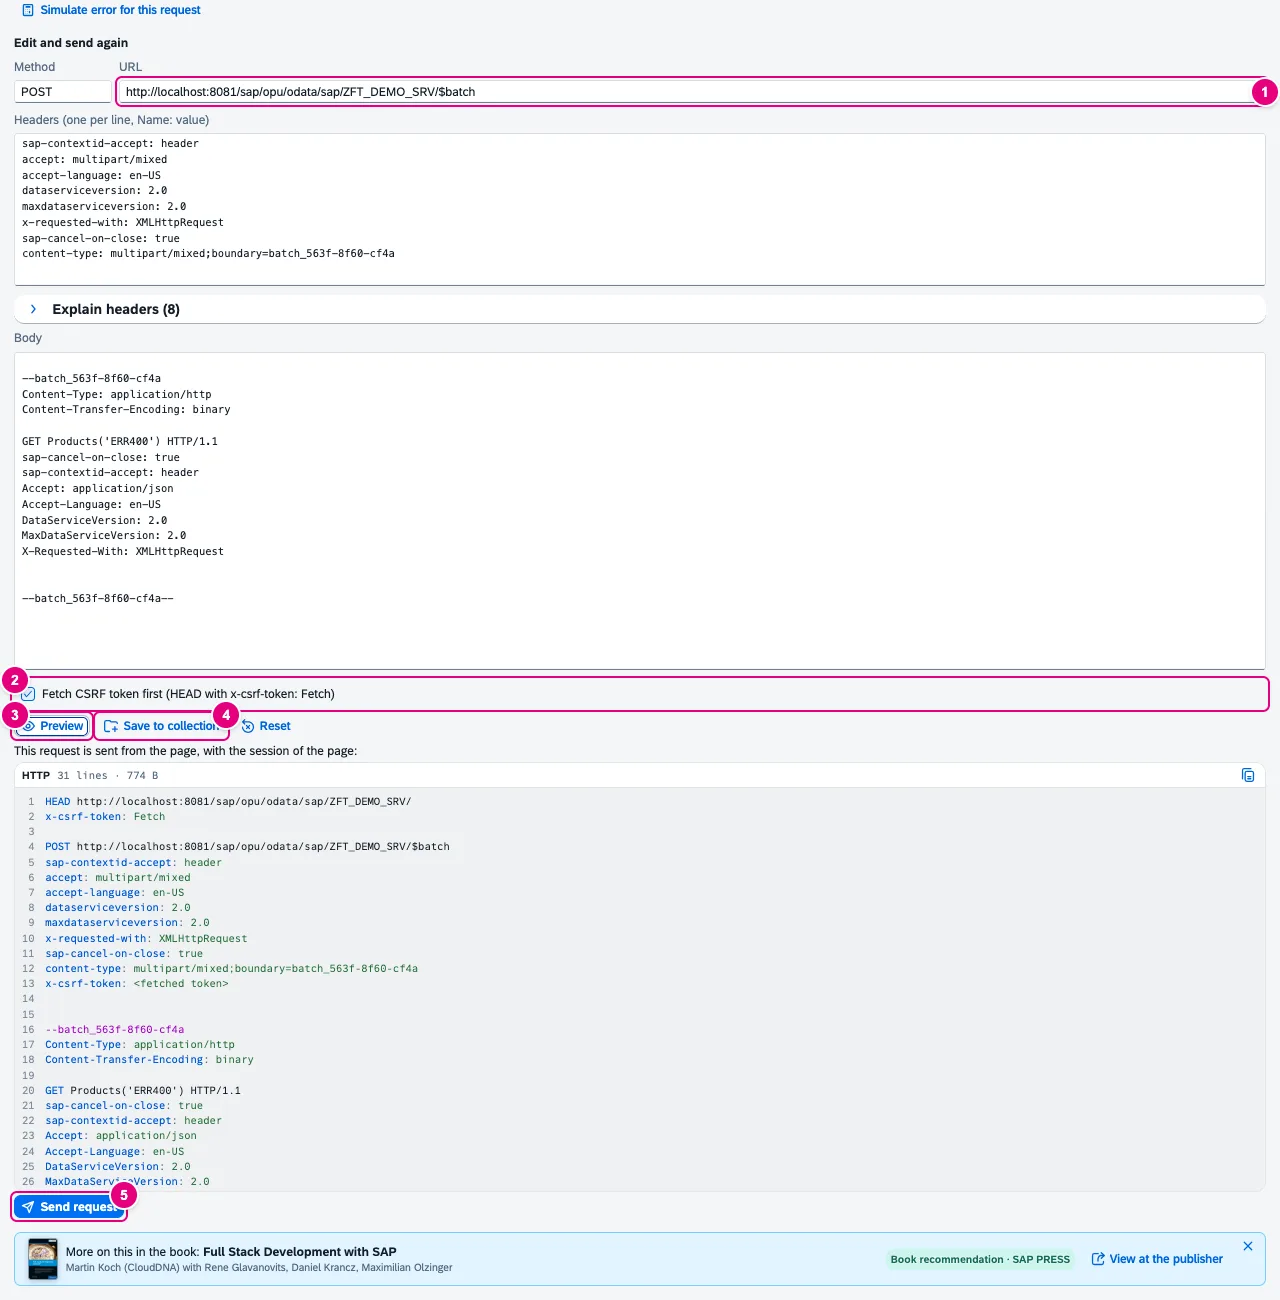
$batch: preview first, then a second click to send.- The request’s URL – only the page’s origin is allowed.
- Fetch CSRF token first: a
HEADwithx-csrf-token: Fetchto the service beforehand. - Preview shows the request that would be sent. No preview, no sending.
- Save to collection keeps the request for later, see collections.
- Send request sends it with the page’s session. Reset restores the original.
Export without secrets
| Button | Result |
|---|---|
| Selected request: Copy as cURL | cURL command on the clipboard. Changing requests fetch a token first and use -c/-b cookies.txt. |
| Selected request: .http (VS Code) | File for the VS Code REST Client with a token fetch first. |
| All shown requests: .http · Postman · HAR | All rows the filter shows. The Postman collection fetches the token in a request of its own. |
Exports are created locally as files and contain neither cookies nor Authorization nor CSRF tokens; the files fetch a token first.
Saved filters and collections
To the left above the table is the Saved filters menu (initially Standard). Save, Save as and Manage store filter sets of status, service, method and text. Make default for this system applies a filter whenever the console opens for this origin.
The Collections view holds saved requests. Before saving, FrontTailor removes cookies, tokens, Authorization and CSRF headers; the URL is stored relative to the service, so the request runs on every system with this service. A saved request runs like a replay: preview first, then send. Import and Export all exchange collections as a JSON file. Filters and collections from team packages appear in a group of their own with from Team, see Team packages.
Metadata: search the service
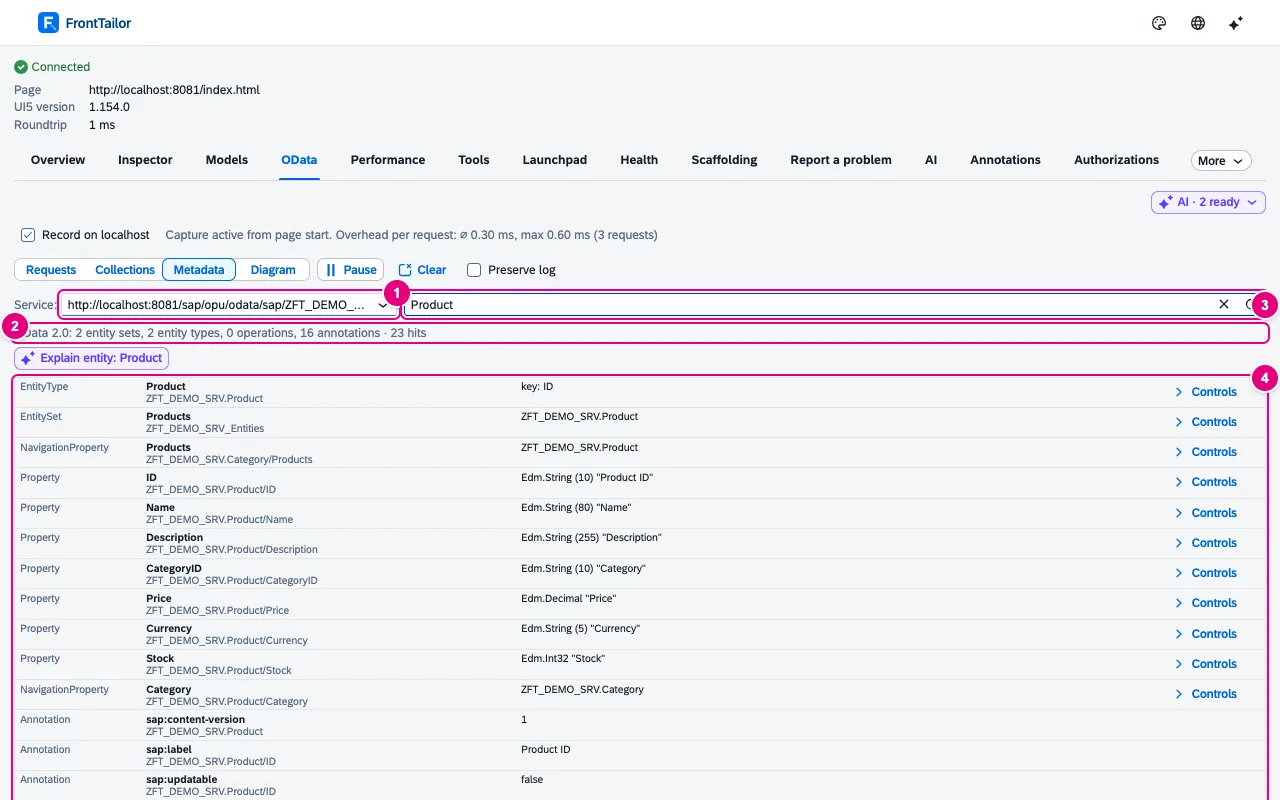
- Choose the service – every service whose
$metadatawas recorded. - The summary: OData version, entity sets, entity types, operations, annotations.
- Search entity sets, types, properties, actions and annotations (including external annotation files).
- The matches. Controls shows which controls on the page bind an element.
If a service is missing, its $metadata was not recorded: reload the app while recording is on.
Diagram: entities and navigations
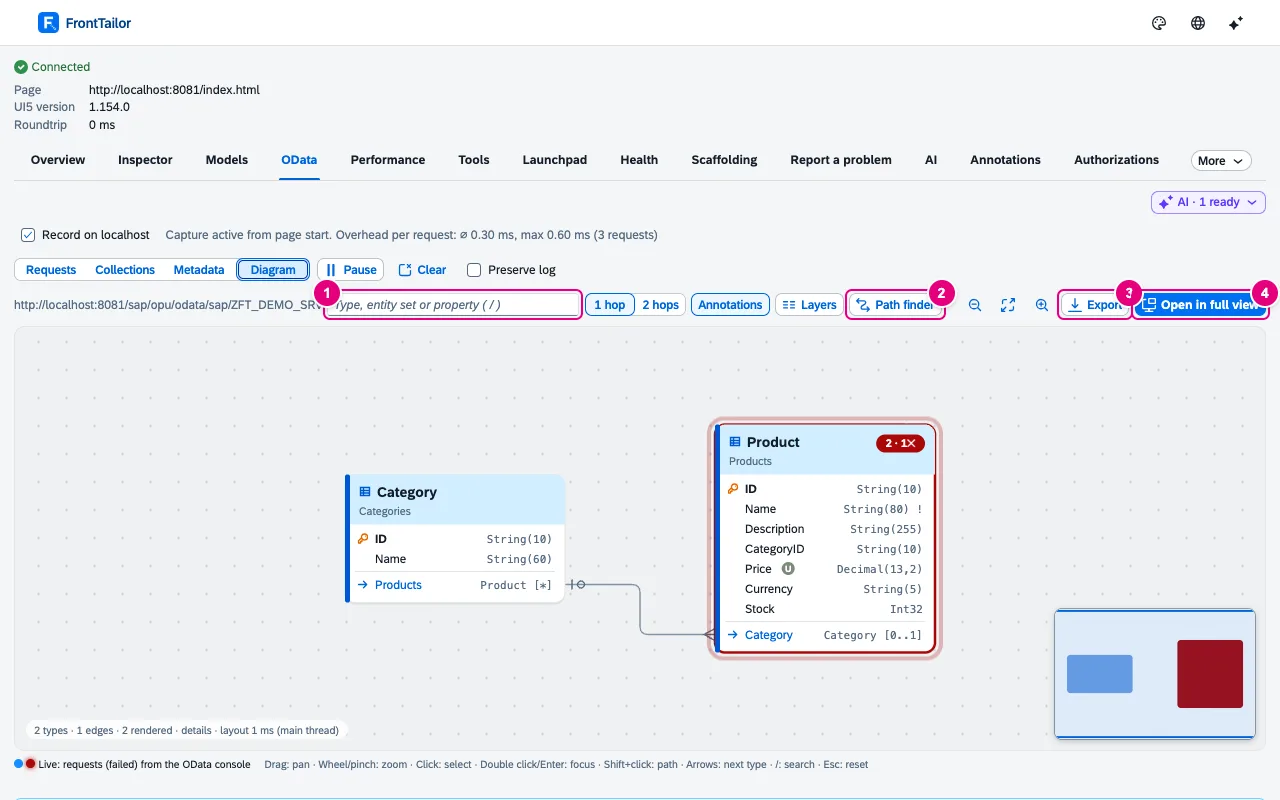
Product shows failed requests from the console.- Search by type, entity set or property (key /). Next to it the neighbourhood (1 or 2 hops), Annotations and Layers (operations, complex & enum types, hide draft).
- Path finder: choose from and to type, Copy $expand returns the navigation path.
- Export: SVG or PNG of the current view, or copy a Mermaid erDiagram.
- Open in full view shows the diagram in a window of its own.
| Key / mouse | Effect |
|---|---|
| Drag · wheel or pinch | Pan · zoom. +, − and 0 (fit to screen) work, too. |
| Click · double-click or Enter | Select a type · focus on the type and its neighbours. |
| Shift+click | Path from the selected type to the clicked one. |
| Arrow keys | Next type. |
| / · Esc | Search · reset the view. |
What is recorded
The console hooks into the page’s XMLHttpRequest and fetch, but changes no request and sets no header. It does not even look at UI5 resources such as .js or .properties. Cookies are removed; Authorization, CSRF tokens and other secrets are replaced by [redacted] while still in the page. Per tab, the log holds up to 2,000 requests or 50 MB, bodies up to 512 KB (request) and 1 MB (response). It is deleted when the tab closes and cleared on reload unless Preserve log is on.
Typical problems
| Problem | Solution |
|---|---|
| Request bodies are not captured on this page | The page was loaded before the domain was granted. Reload, or Start capture now. |
| Rows with Network data only | These requests ran before capture started. Status and timing are there, bodies are not. Reload. |
| An error is missing in the overview’s session | A $batch often answers 200 even when a part fails. The console shows such parts in red, the session counts HTTP errors only. |
| Metadata or diagram are empty | $metadata was not recorded. Reload the app while recording is on. |
| Send request is locked | The host is PROD. Replay exists on development and test systems only. |
| Recording is missing entirely | The Record on … checkbox is off, or your administrator disabled the console (“Recording is disabled by your administrator.”). |
See also
- Features at a glance Features · OData
- Further reading Full Stack Development with SAP (SAP PRESS)
- Further reading SAP Fiori Elements – Development and Extensibility (SAP PRESS)
- Help from people Fiori elements and annotations
- Docs Fault simulation
- Docs Known errors
- Docs Backend jump
- Docs Model explorer
- Sources ADR-0071 · ADR-0152 · ADR-0293